Reports
ArchNGN provides interactive visualisations and pre-built reports for communicating architectural insights to different stakeholders.
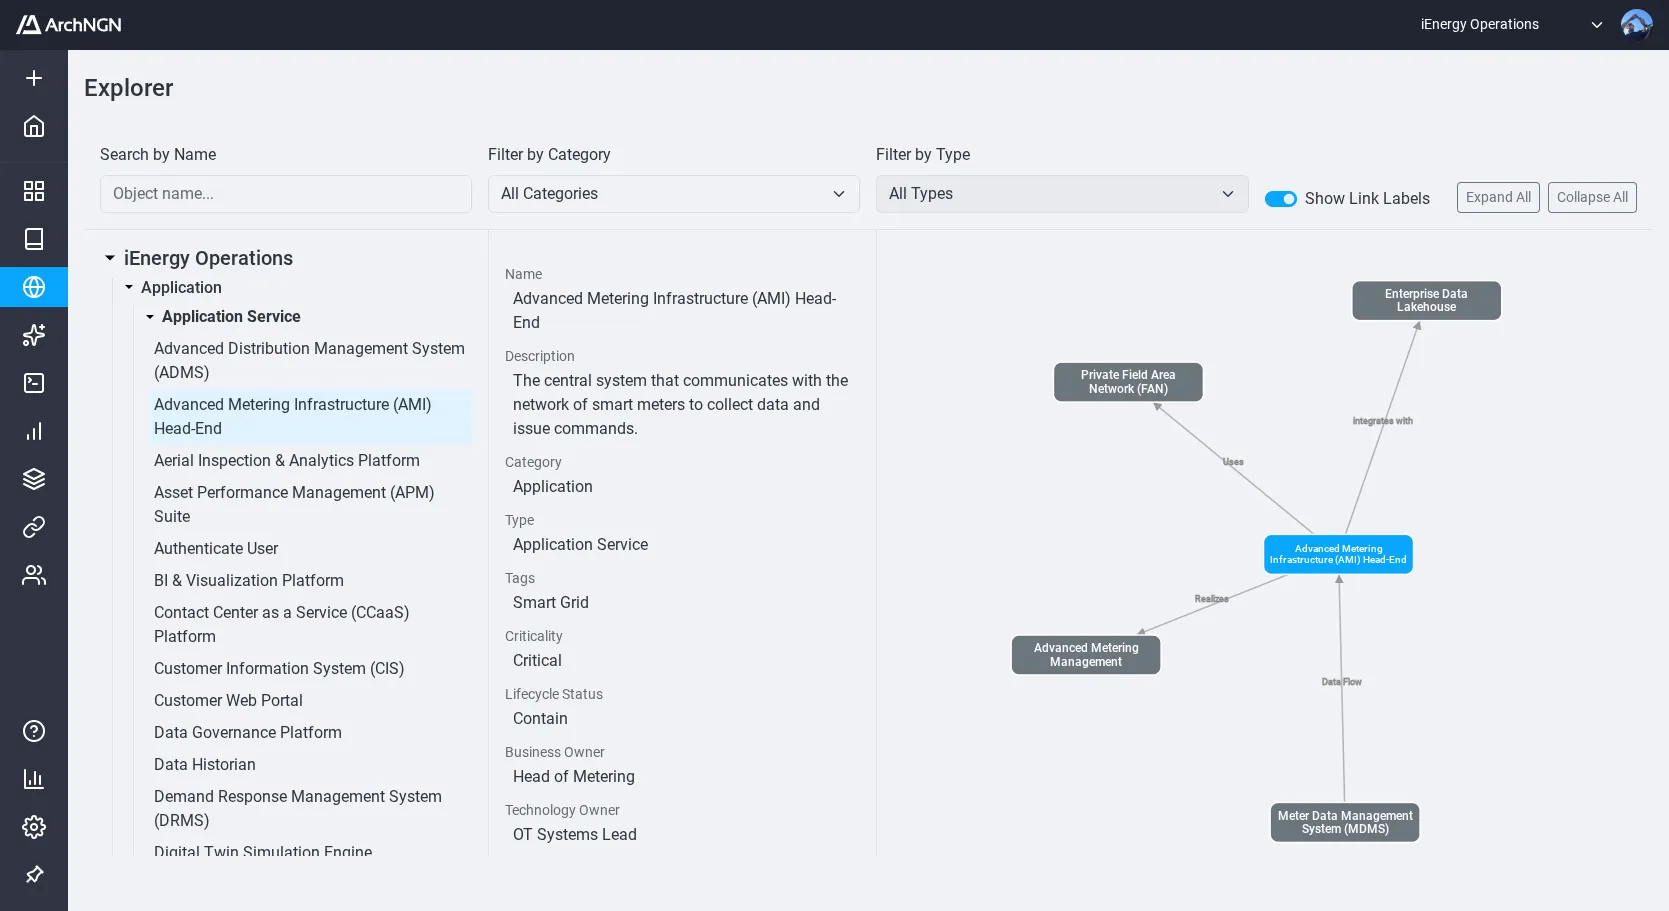
Explorer & Graph View
Section titled “Explorer & Graph View”The Explorer page provides an interactive Graph View that renders objects and associations as a node-and-edge network. Select an object to view its direct associations and trace data-flow lineage. Use category filters to isolate specific architectural layers.
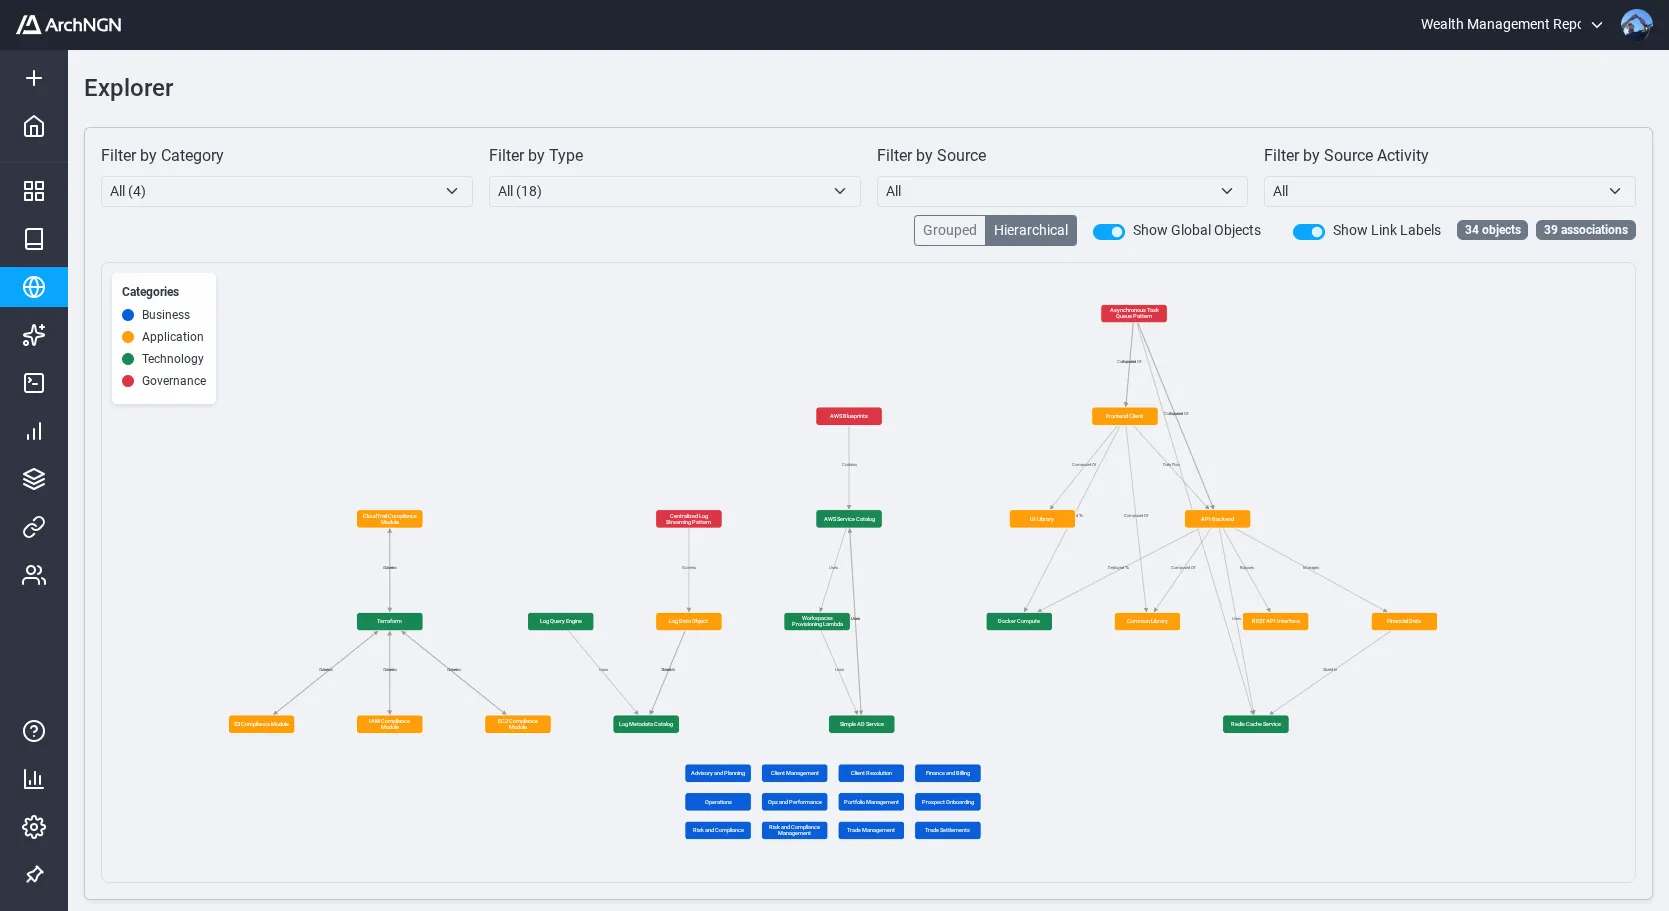
Select any node to drill into its direct neighbourhood and trace dependencies in either direction.
Standard Reports
Section titled “Standard Reports”Pre-built reports map your architectural data to common enterprise viewpoints.
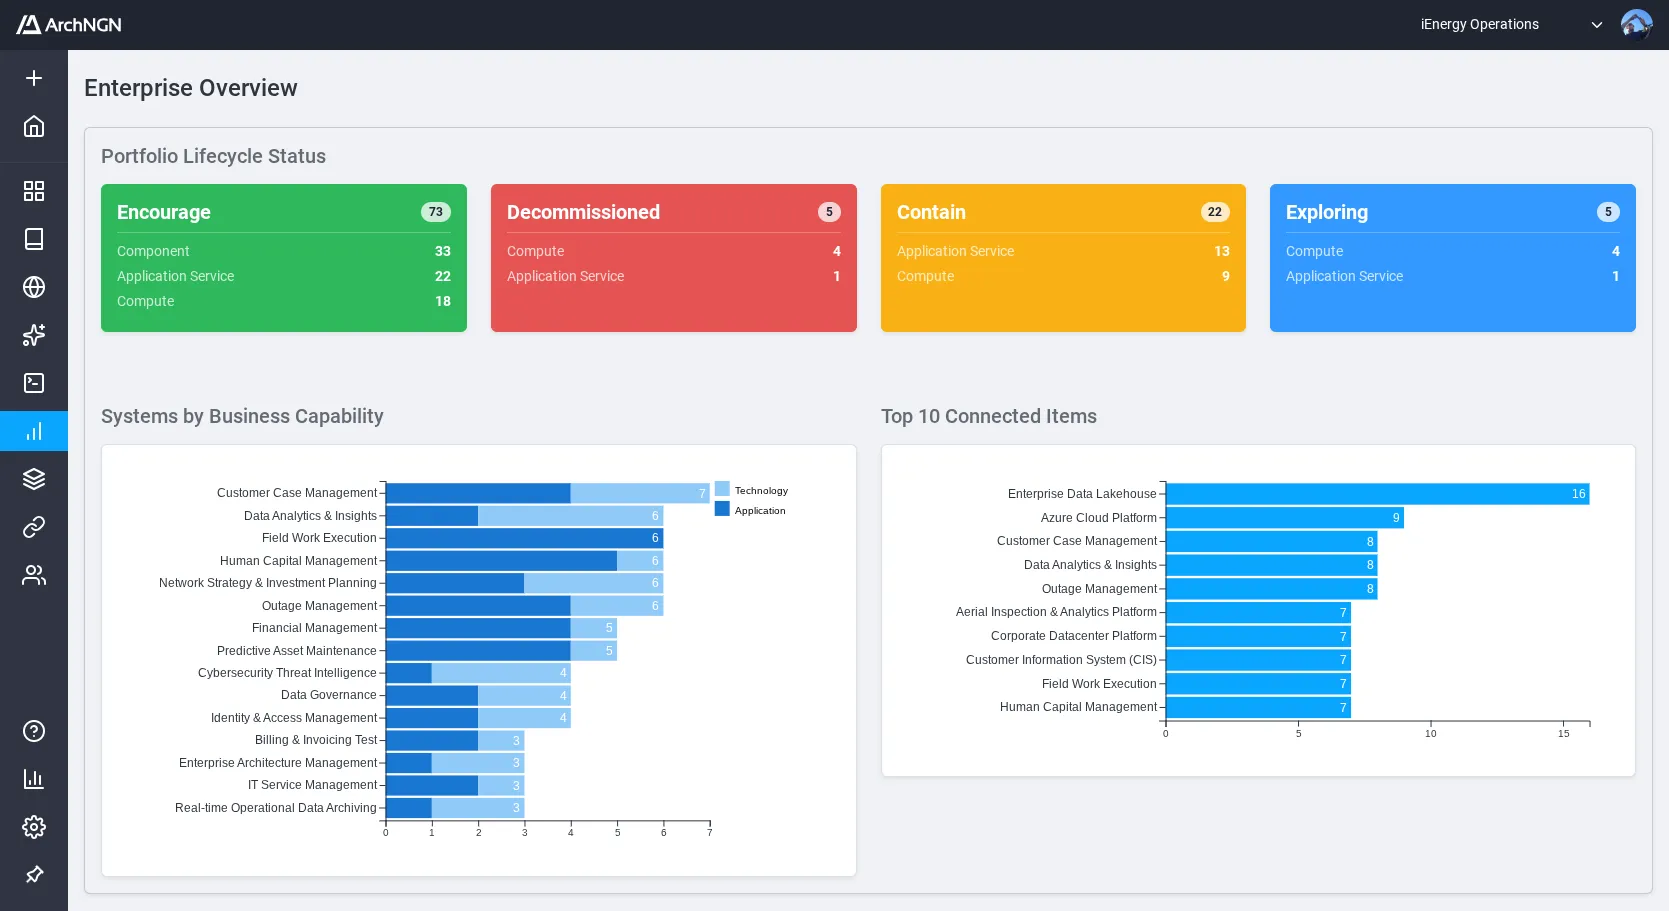
Enterprise Overview
Section titled “Enterprise Overview”Portfolio health, lifecycle status distribution, and connectivity statistics across the full landscape.
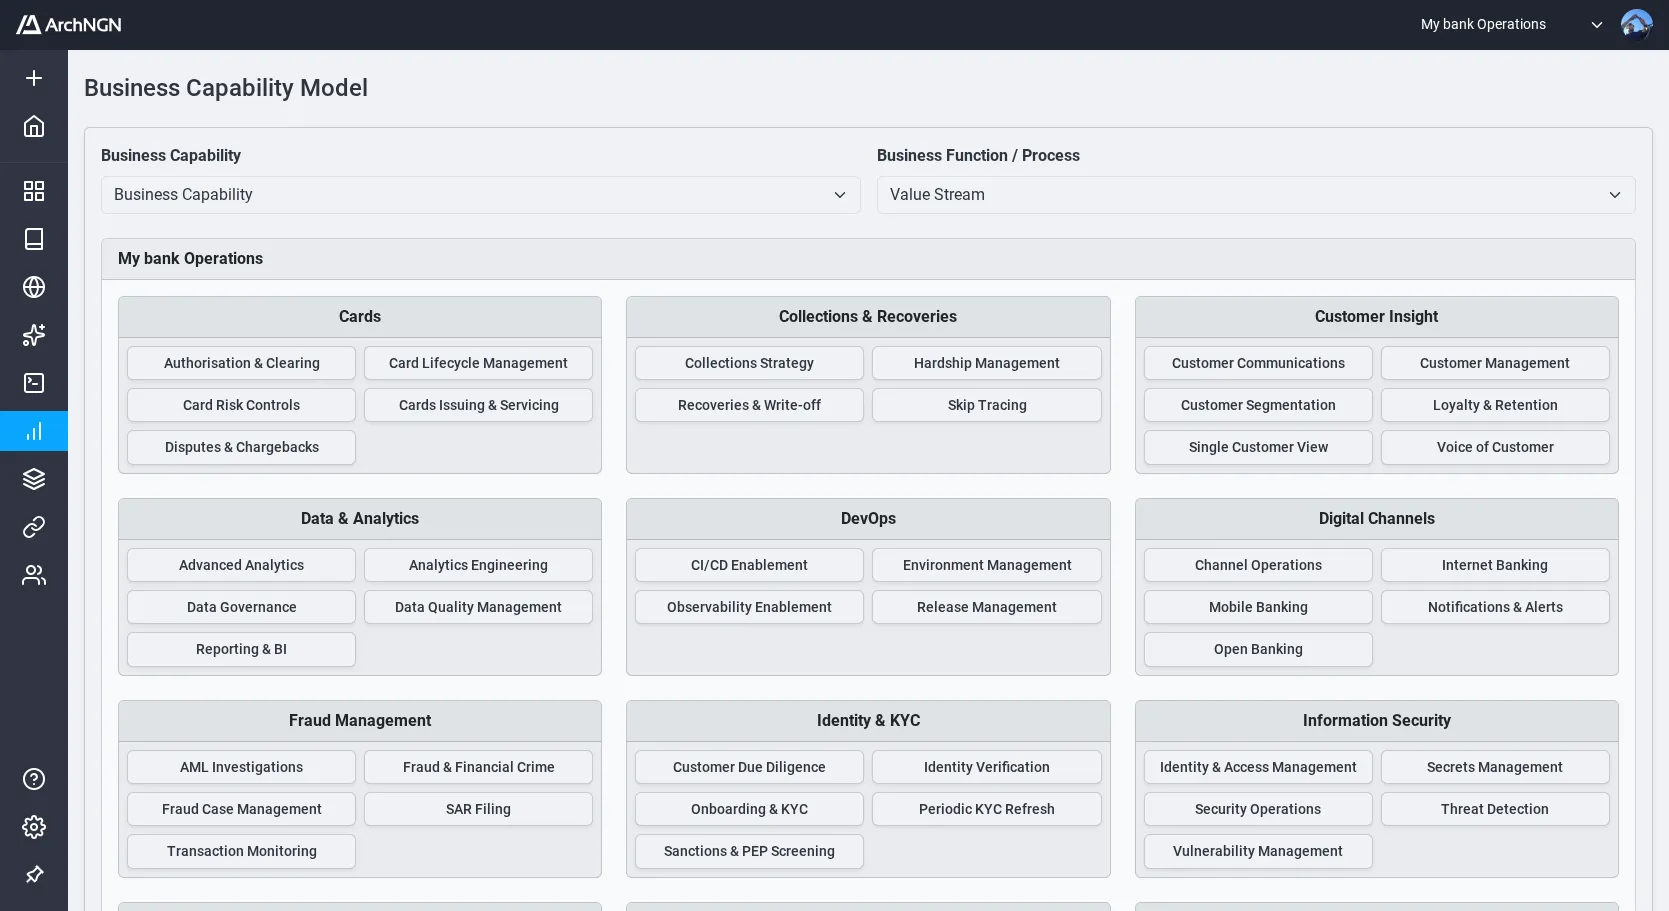
Business Capability Model
Section titled “Business Capability Model”How business capabilities are supported by application and technology systems.
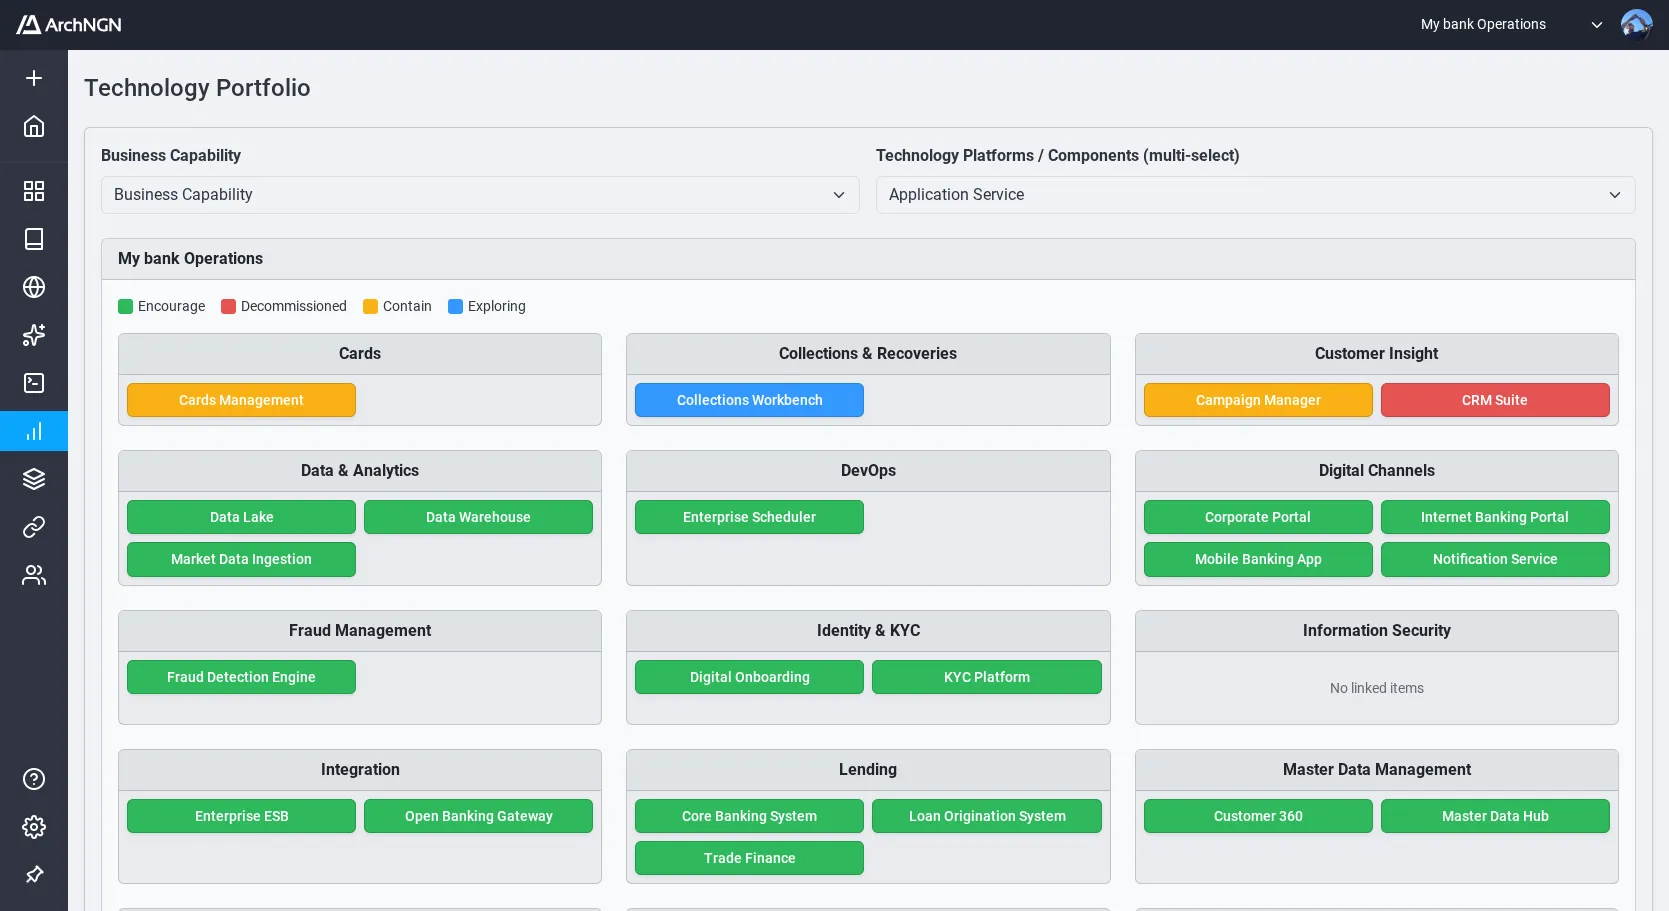
Technology Portfolio
Section titled “Technology Portfolio”Technology component status, lifecycle phase, and categorisation.
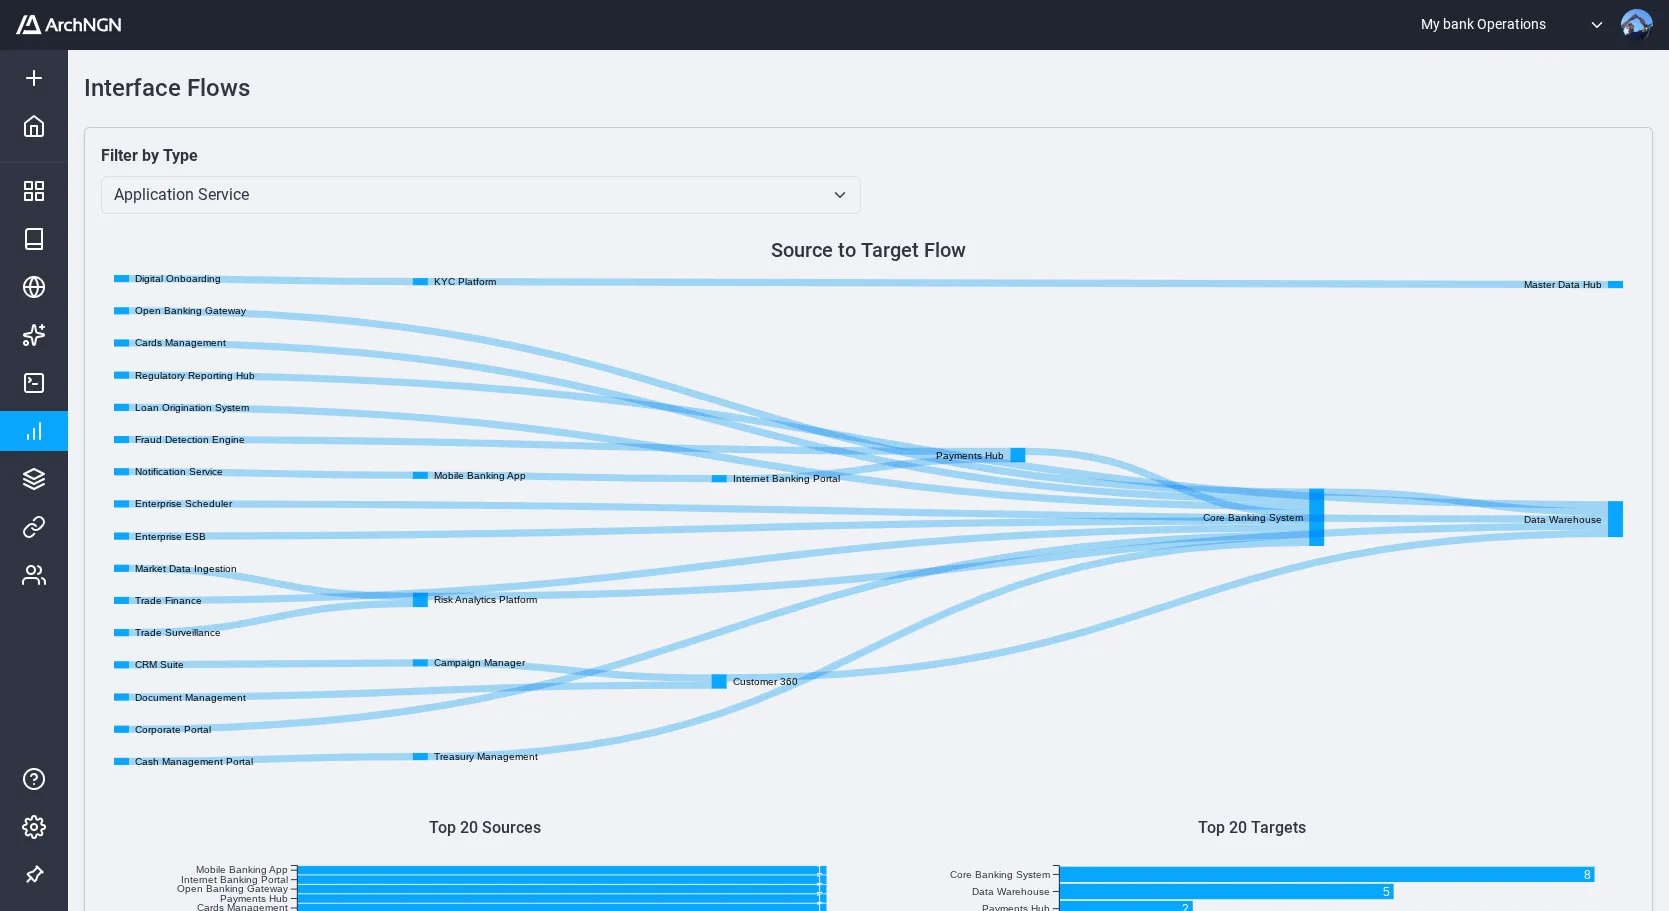
Interface Flows
Section titled “Interface Flows”Information flow and integration patterns between systems.
Other Reports
Section titled “Other Reports”- Application Landscape — Application relationships, functional coverage, and dependencies
- Application System Register — Filterable register of all application and technology objects
- Data Domains — Data structure, entities, and data flows
These reports are populated from the objects and associations in your workspace. Creating objects and associations with these viewpoints in mind will produce the most useful reports.