Reports
Reports turn the active workspace’s model into views you can share with stakeholders. Open Reports in the sidebar and choose one. ← Back to Reports returns to the list.
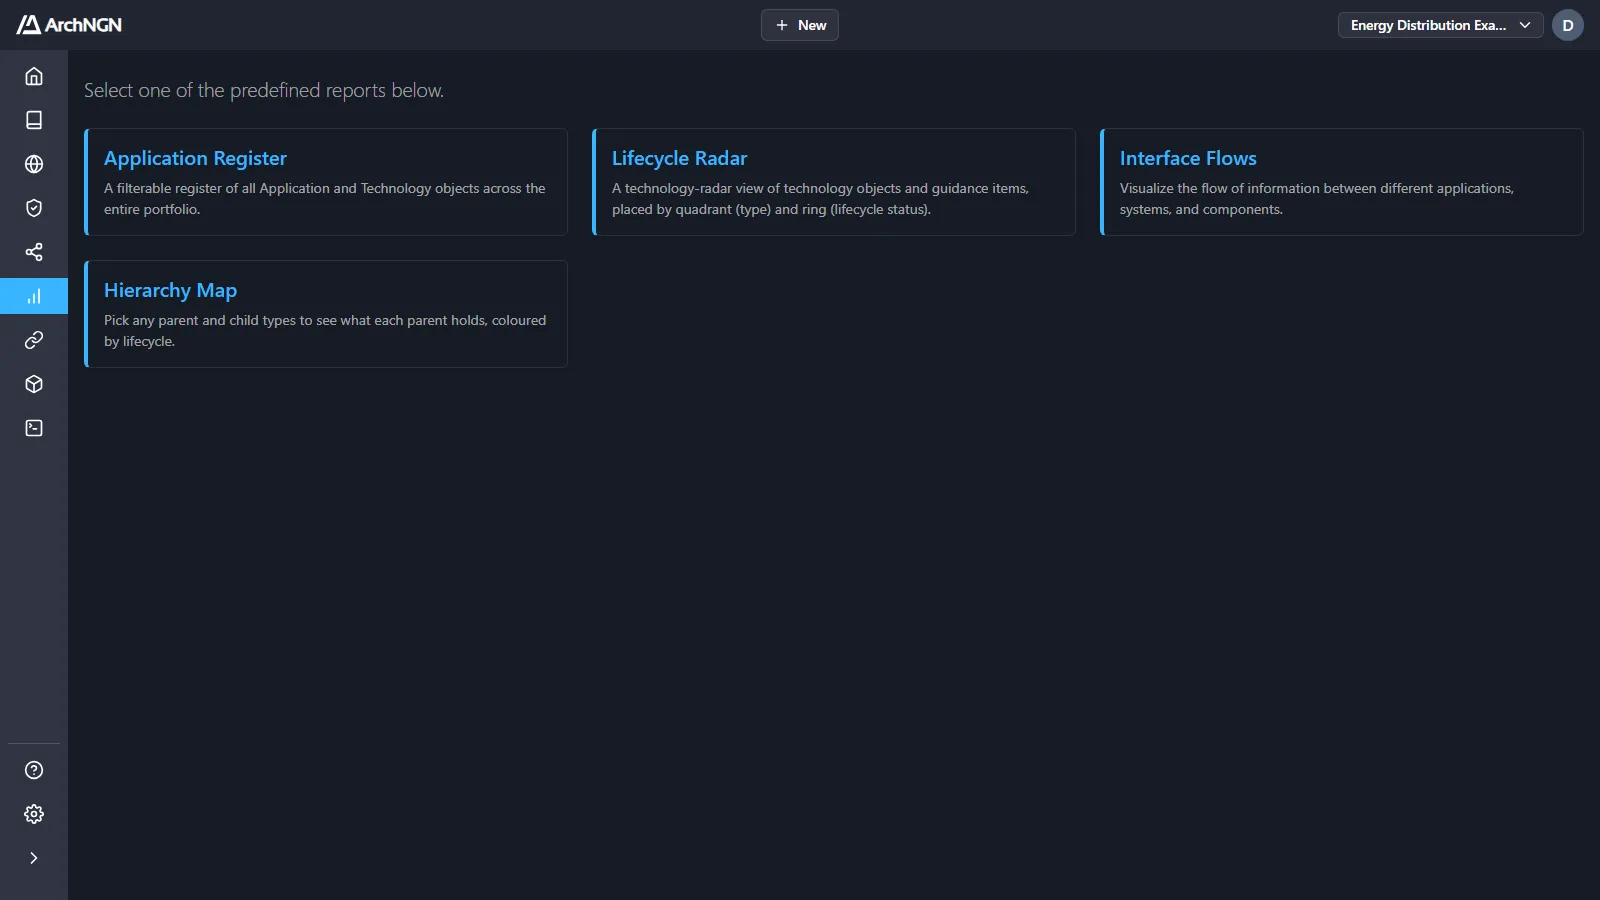
For interactive graphs of the same model, see the Explorer.
Application Register
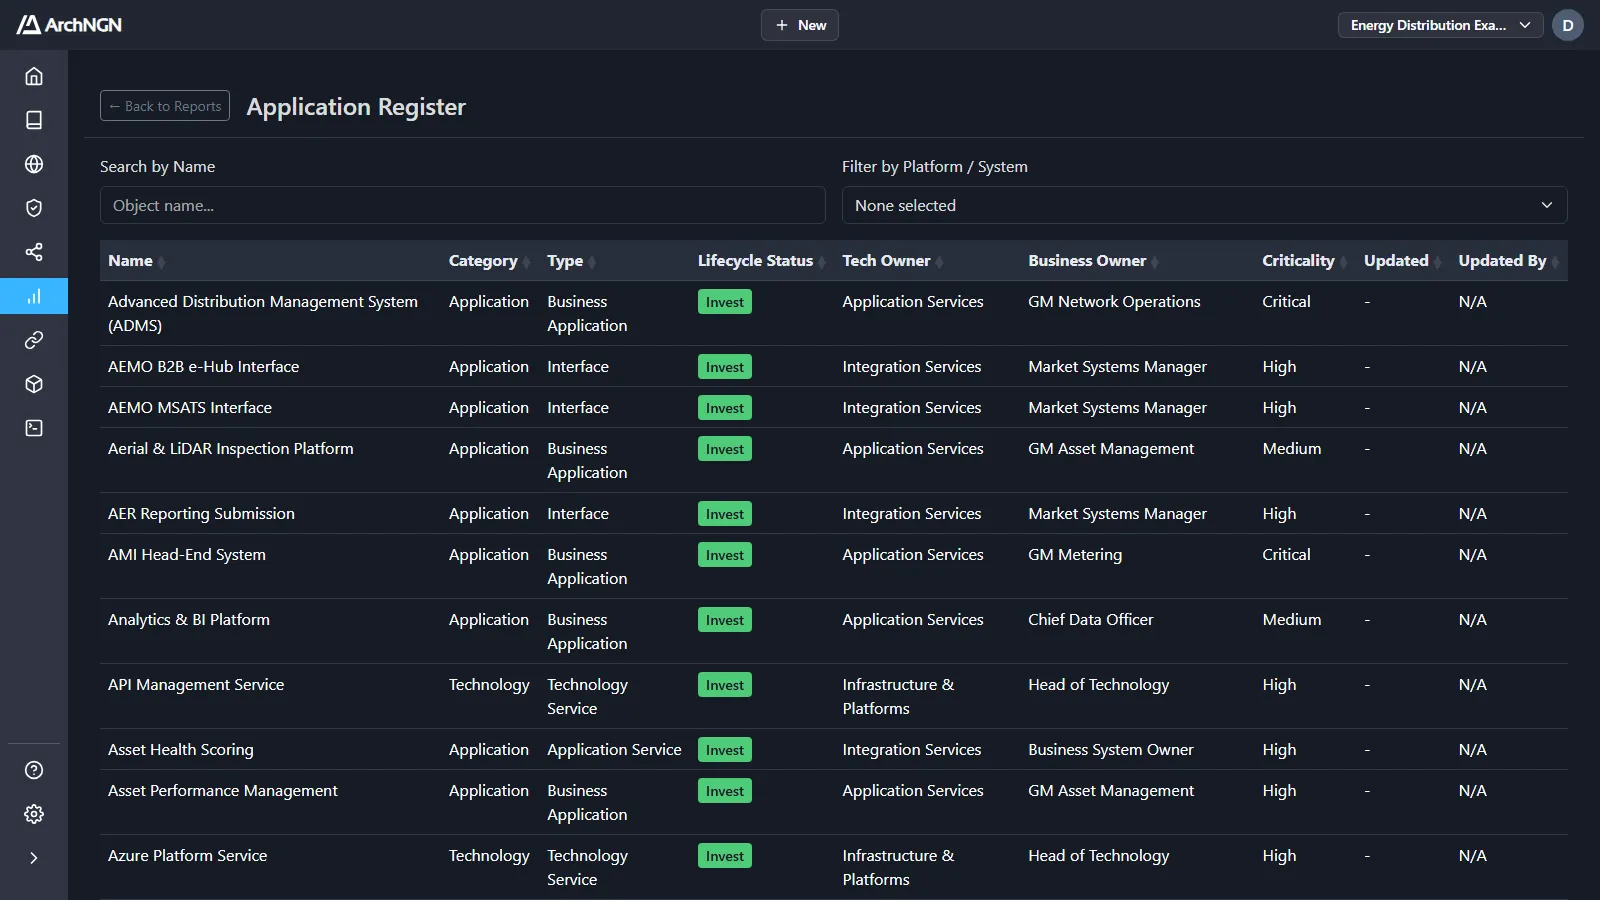
Section titled “Application Register”A filterable register of every Application and Technology object in the portfolio: category, type, lifecycle status, technology and business owners, criticality, and when and by whom it was last updated. Search by name, filter by platform or system, and sort by any column.
Lifecycle Radar
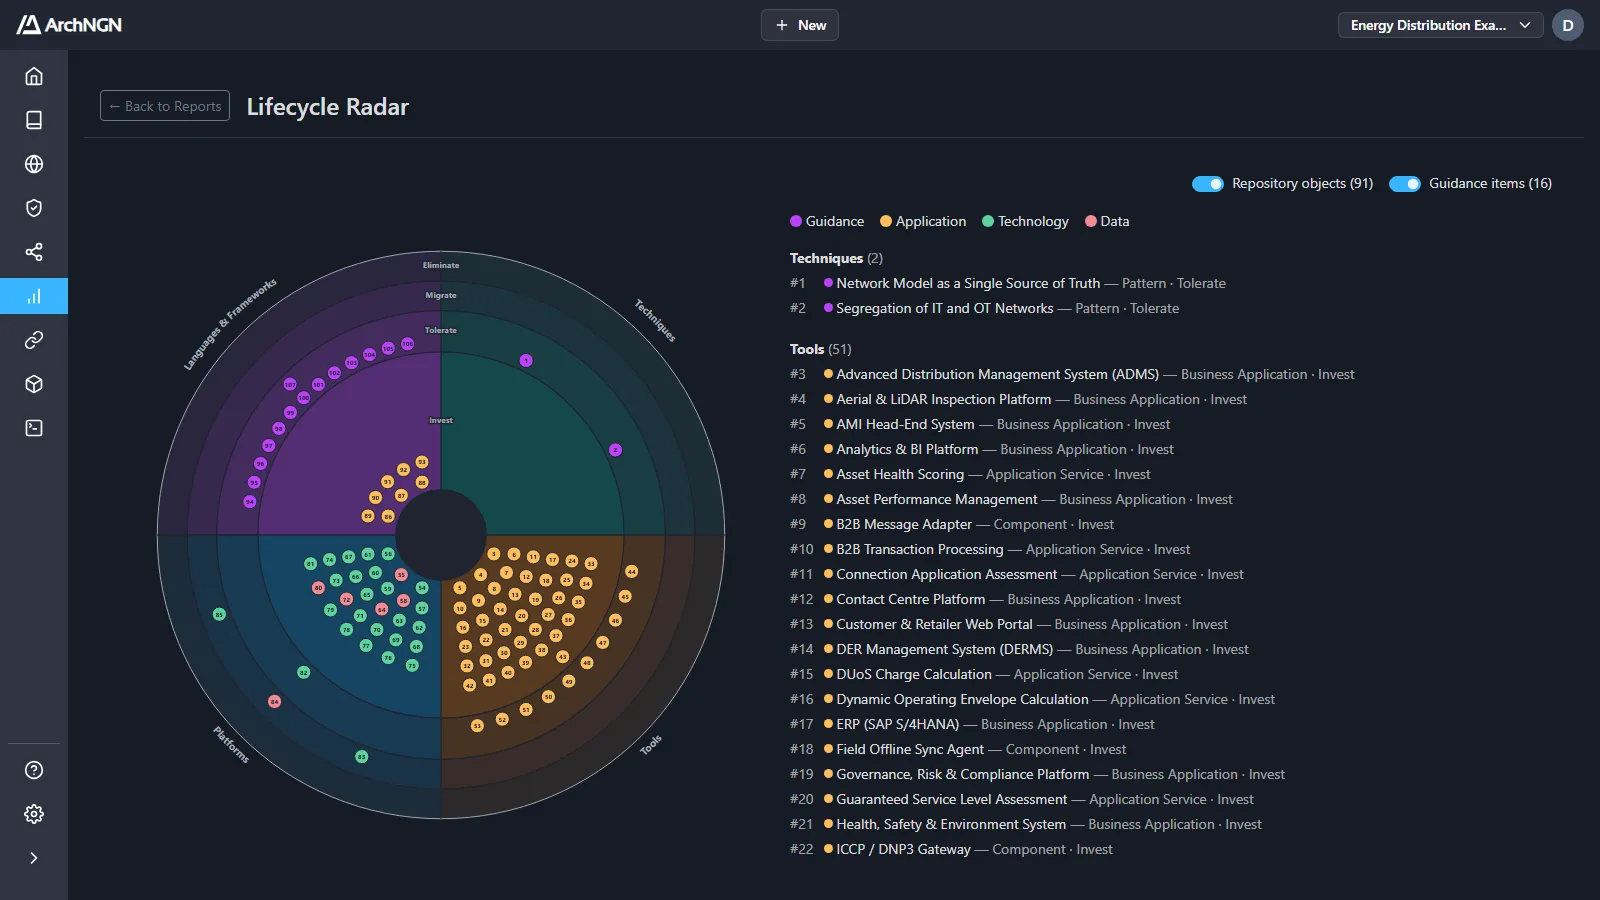
Section titled “Lifecycle Radar”A technology radar. Each technology object and guidance item is placed by quadrant (its type: Techniques, Tools, Platforms, or Languages & Frameworks) and ring (its lifecycle status: Invest, Tolerate, Migrate or Eliminate). The numbered list beside the radar names every blip.
Switch Repository objects and Guidance items on or off to show one or both. Guidance comes from the Reference Library: patterns and decisions are Techniques, for example.
Interface Flows
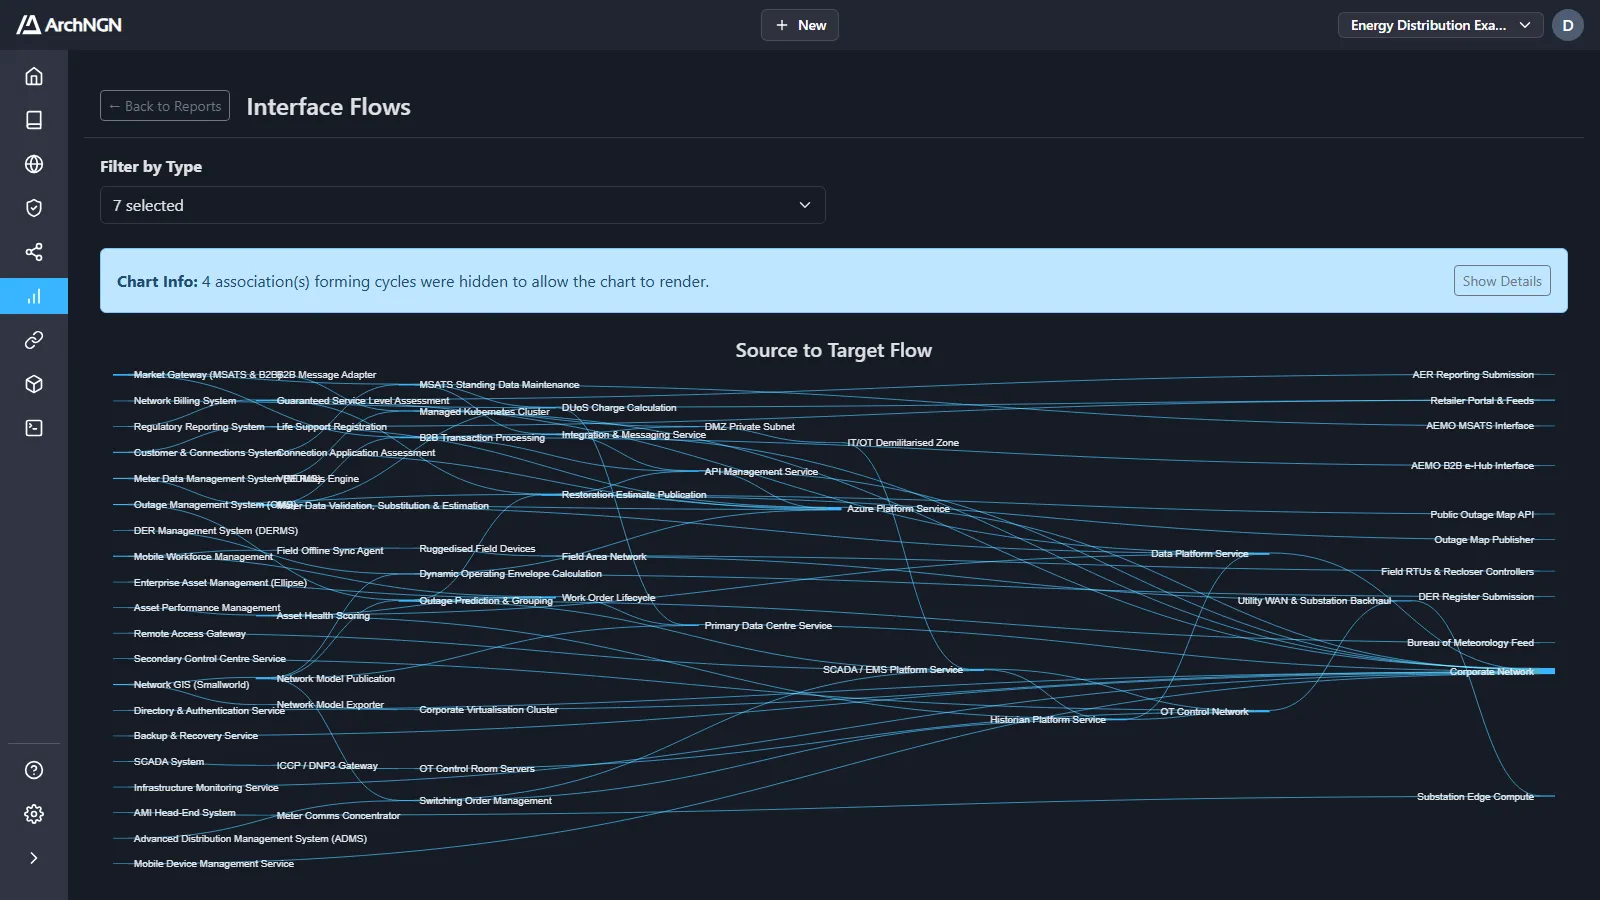
Section titled “Interface Flows”How information flows between applications, systems and components, drawn from source to target. Filter by Type chooses which object types appear. Links that would form a loop are hidden so the chart can draw, and the report says how many. Show Details lists them.
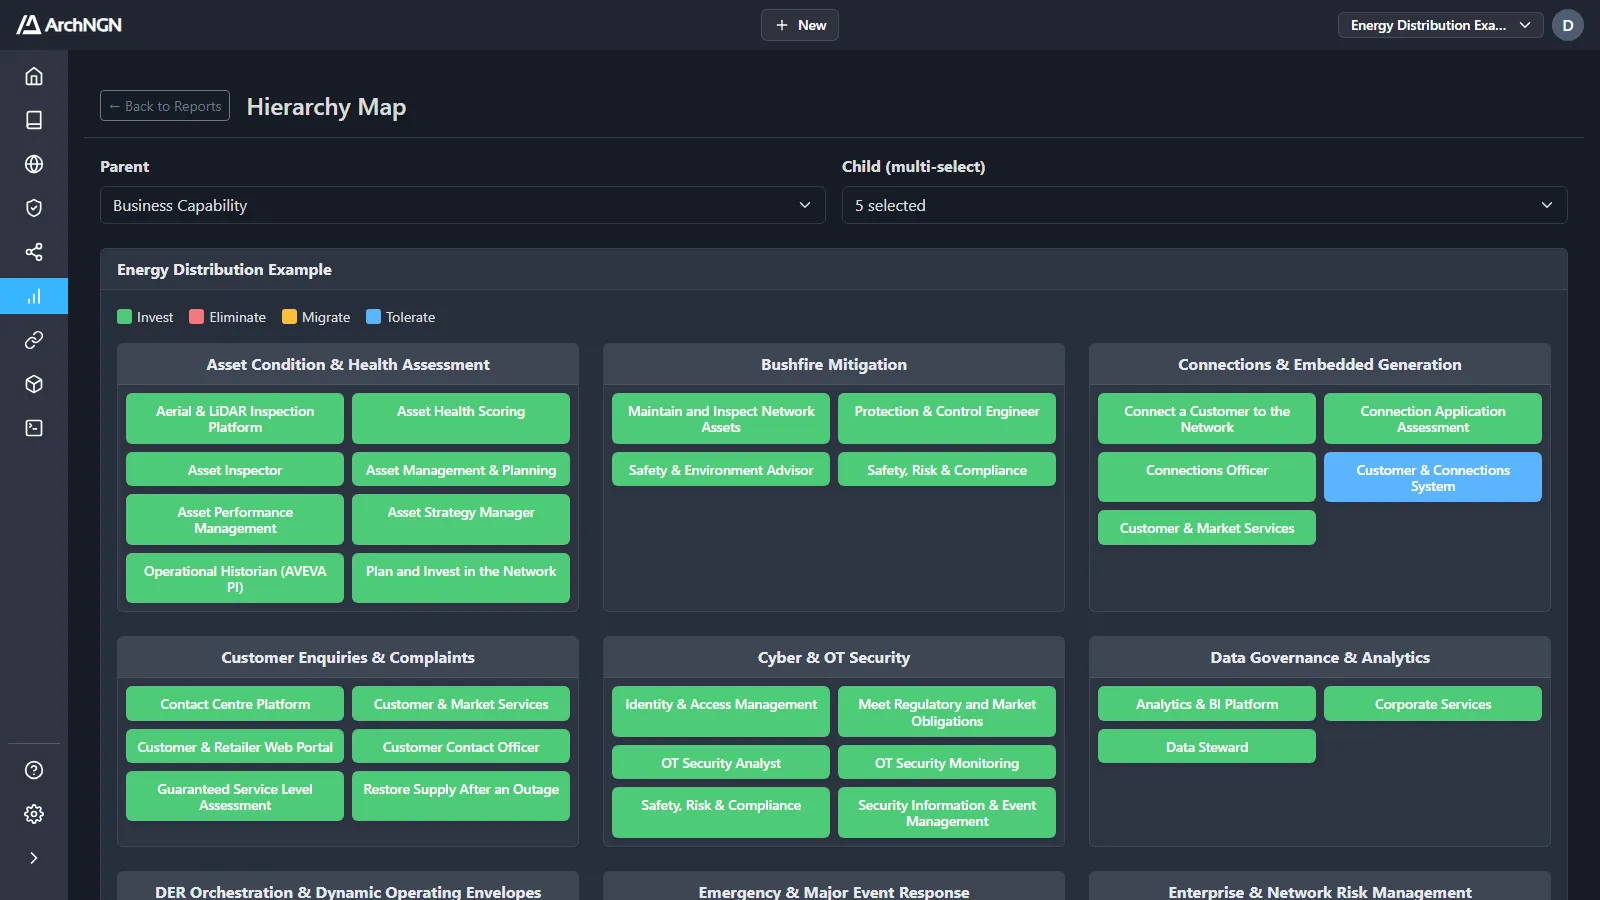
Hierarchy Map
Section titled “Hierarchy Map”Pick any Parent type and one or more Child types to see what each parent holds, coloured by lifecycle status. For example: each business capability and the applications, roles and processes under it.
Get the most from reports
Section titled “Get the most from reports”Reports read the objects and associations in the workspace. Lifecycle status, owners and criticality fill most of the columns and colours, and associations decide what sits under what. Keep those current, and the reports stay current with them.
For the traceability of a generated design, see Workstreams.